Tags archives: app
-
Sometimes it's just easier to take a picture for the purpose of note taking. Well, Percentally Pro 2 has you covered with a feature for taking photos or choosing photos from your photo library. Then, you can export a note with your photos. The following steps will allow you to add photos and to export a note: Add photos to a note Tap the Students tab Select a student Tap the + to add a new note Tap ‘Add Photo’ or the Camera button Add a photo by using your device’s Camera or Photo Library. You may add up to 5 photos per note. Tap Save Export a note Follow steps 1-6 in ‘Add photos to a note’ With the Notes segment selected, tap on a note's date Tap the action button (box with arrow going out) Select a method (e.g., Mail, Dropbox) for sharing your note For mo[...]
-
It's the end of the school year and time to clean up. It's good to clean up your paperwork, but it's also important to clean up your digital work. If you're using Percentally Pro 2, you can delete items that you no longer need in the app. Before you start deleting, I recommend that you export and backup your data. You should export all student data for progress summaries and your records. To export student data, check out this tutorial: http://expressive-solutions.com/percentally-pro-2-export-student-data/. In the unfortunate case that you delete more than you wanted, you'll also want a backup file to restore. To backup and restore your data, check out this tutorial: http://expressive-solutions.com/percentally-pro-2-backup-and-restore-data/. In Percentally Pro 2, there are various de[...]

-
Percentally Pro version 2.3 is now available. Here’s a list of what's new: • Input quantitative data for a selected student during an active session • Export Averages/Sums for a range of dates • Add/Remove students to/from a session that started • Enhanced undo feature • Bug fixes If you like the new features, please leave a comment on the iOS App Store listing for Percentally Pro 2. If you have feedback, please email support@expressive-solutions.com.
-
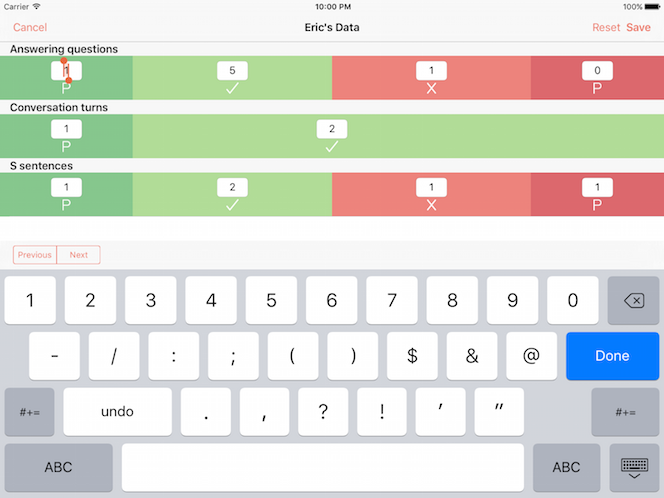
When you’re collecting data in Percentally Pro 2, you may want to input specific values for your students’ goals. The opportunity may arise if the Undo button is not enabled, you need to recreate data collected outside of the app, or to fix tallying mistakes. The following steps will allow you to input quantitative data for a selected student: 1. Follow steps 1-3 in ‘Collect Data’ 2. With a given student selected, tap the Input button (rounded square with a 1 in the middle) 3. Select a field to input data for the desired goal 4. Tap the Previous and Next buttons to navigate the text fields corresponding with your student’s goals 5. If you want to reset all values to 0, tap the Reset button 6. Tap the Save button to save the changes For more information, check out the Percentally[...]
I am currently doing a Udacity course in which I need to post how I can add functionality to an iOS app we’re building to play sound. So, I decided to write a post regarding how to play a sound indefinitely, given that I was previously shown how to play a soun[...]

-
Percentally Pro version 2.2 is now available. Here’s a list of what's new: • Export line charts as a PDF file • Enhanced tally view for collecting quantitative data • Data type (Percentally or Tally) identified under student's goal title • Delete All Options for goals, students, and sessions • Bug fixes If you like the new features, please leave a comment on the iOS App Store listing for Percentally Pro 2. If you have feedback, please email support@expressive-solutions.com.
-
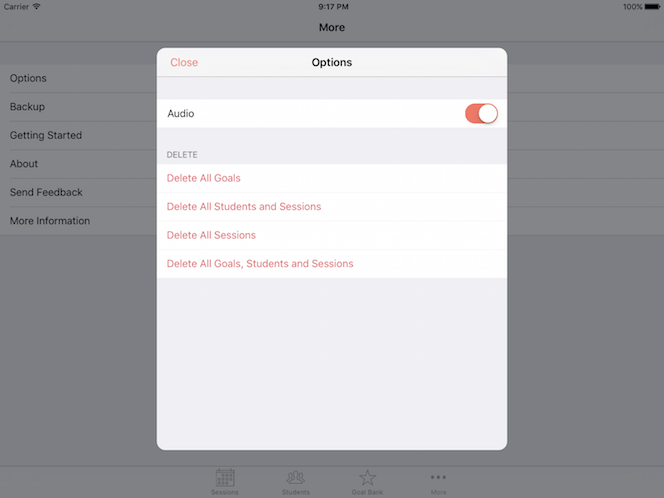
In addition to deleting individual data in Percentally Pro 2, data can be deleted in a batch. 1. If you want to delete data in a batch, begin by tapping the More tab 2. Select the Options row 3. In the Delete section, select the row for the desired data (all goals, all students, and/or all sessions) to delete 4. Tap Delete to confirm the data you want to delete For more information, check out the Percentally website page.
-
Percentally Pro version 2.1 is now available. Here’s a list of what's new: • View data rings in session summaries • View and export line charts with a configurable target line for student goals • Landscape support for iPhone • Hide completed and deselected goals from active sessions • Delete measurements after they're saved • Swipe to delete sessions, students, goals, measurements, and notes • In-app help guide • Bug fixes If you like the new features, please leave a comment on the iOS App Store listing for Percentally Pro 2. If you have feedback, please email support@expressive-solutions.com.
-
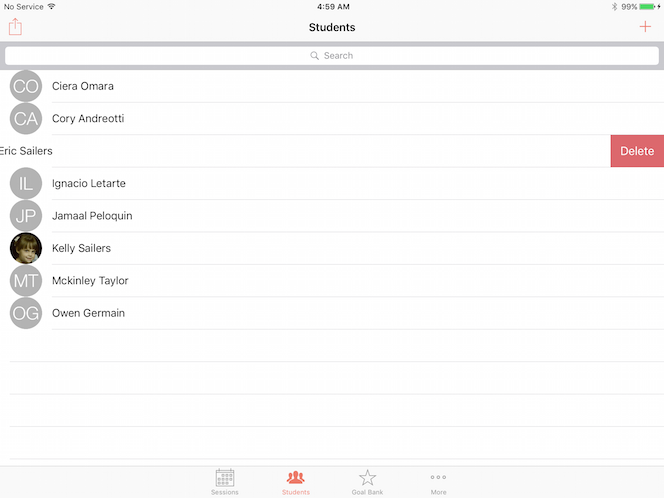
In Percentally Pro 2, there are various items of data to delete. It is possible to delete sessions, students, goals, and notes. For each item, there are two ways to delete it. You can either swipe to delete the corresponding table row, or you can tap the delete button in the corresponding bottom toolbar. 1. If you want to delete a student, begin by tapping the Students tab 2. Swipe from right to left in a row for a given student 3. Tap the Delete button 4. Alternatively, select a student 5. Tap Delete Student and confirm that you want to delete the student and all of their data For more information, check out the Percentally website page.
-
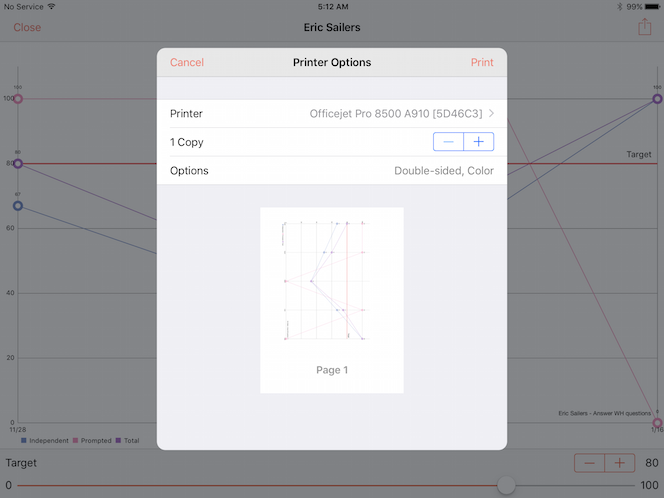
In Percentally Pro 2, charts are exported for data in a student’s goal, all of a student’s goals, or all students’ goals. When exporting, various options include Save Image, Print, and Mail. 1. Follows steps 1-6 in 'View a chart' 2. Follows steps 2-4 in 'Export data for all students'. Note that charts are also exported when you 'Export data for all students', or you 'Export data for one student'. Furthermore, the orientation of the chart(s) will be exported in the orientation of the device at the time of tapping the Action button (box with arrow going out). For example, if the device is in landscape orientation when tapping the Action button, the chart(s) will be exported in landscape orientation. 3. Choose to Save Image for saving to your camera roll, or Print to print to an Air Prin[...]
-
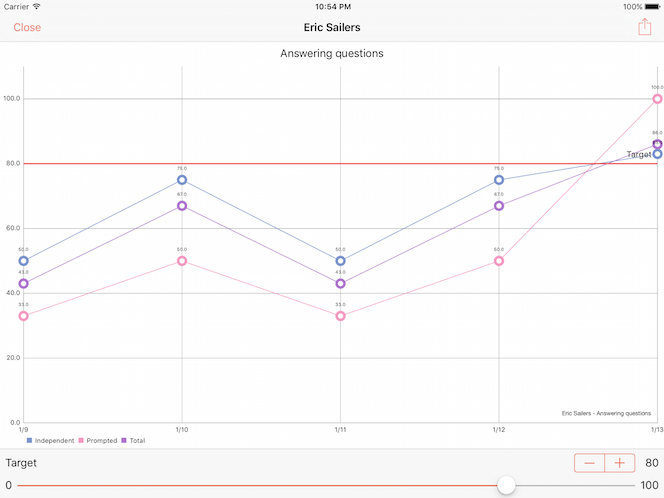
Percentally Pro 2 has line charts for you to view visual representations of your students’ data. The line chart shows your student’s quantitative data for a given goal. 1. Tap the Students tab 2. Select a student 3. With the Goals segment selected, select a goal 4. Tap the Line Chart button in the navigation bar 5. If desired, set the value (0 - 100) for the Target line using the stepper or slider For more information, check out the Percentally website page.
-
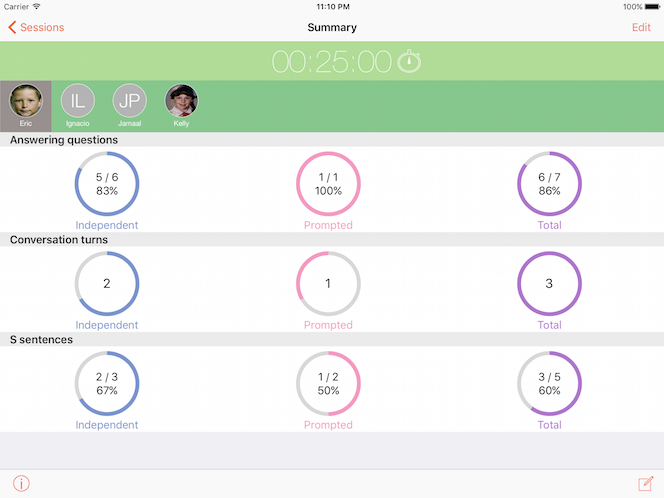
Percentally Pro 2 has two different ways to view a completed session. You can view all students’ data from a completed session via the Sessions tab, or you can view one student’s data from a completed session via the Students tab. 1. To view all students’ data from a completed session, tap the Sessions tab 2. Select a row with a green checkmark 3. Select each student to view their data 4. Go back 5. To view data for one student from a completed session, begin by tapping the Students tab 6. With the Summaries segment selected, tap on a row for a given session to view the student’s data For more information, check out the Percentally website page.