Percentally Pro 2: View a Chart
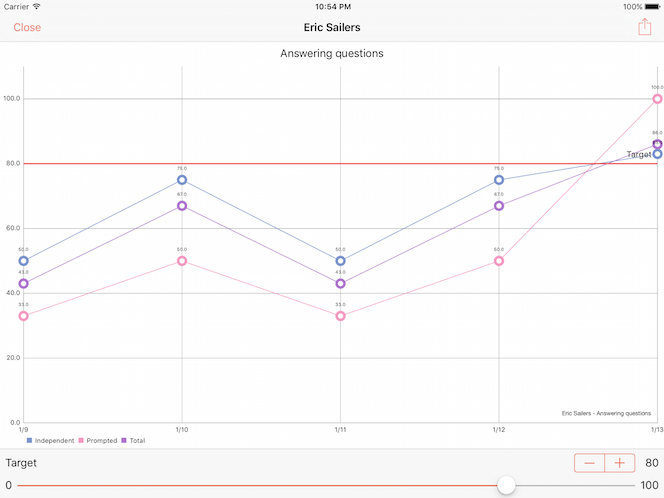
Percentally Pro 2 has line charts for you to view visual representations of your students’ data. The line chart shows your student’s quantitative data for a given goal.
1. Tap the Students tab
2. Select a student
3. With the Goals segment selected, select a goal
4. Tap the Line Chart button in the navigation bar
5. If desired, set the value (0 – 100) for the Target line using the stepper or slider
For more information, check out the Percentally website page.