Use Percentally Pro 2 to collect data for communication partners
Lately, there has been increased discussion of coaching communication partners, and collecting data to track the effectiveness and frequency of modeling. For example, PrAACtical AAC posted a sample data collection form this week. As an AAC Specialist working in a school district, I’d like to share how I use Percentally Pro 2 – my iOS app for data collection – to track the progress of communication partners (e.g., staff, parents, peers) modeling with aided language stimulation. When coaching communication partners such as special education staff, I assess modeling across a variety of communicative functions: ask a question, comment, protest, request, and share information.
In Percentally Pro 2, I start by enabling zeroes for measurements (More > Options > Include Zeroes ON (as indicated by the orange switch)) if they’re not already enabled. Next, I assign goals (previously added) for the aforementioned communicative functions and the total number of models to the communication partner. Then, I collect data on the goals during 15 minute periods throughout the duration of my coaching.
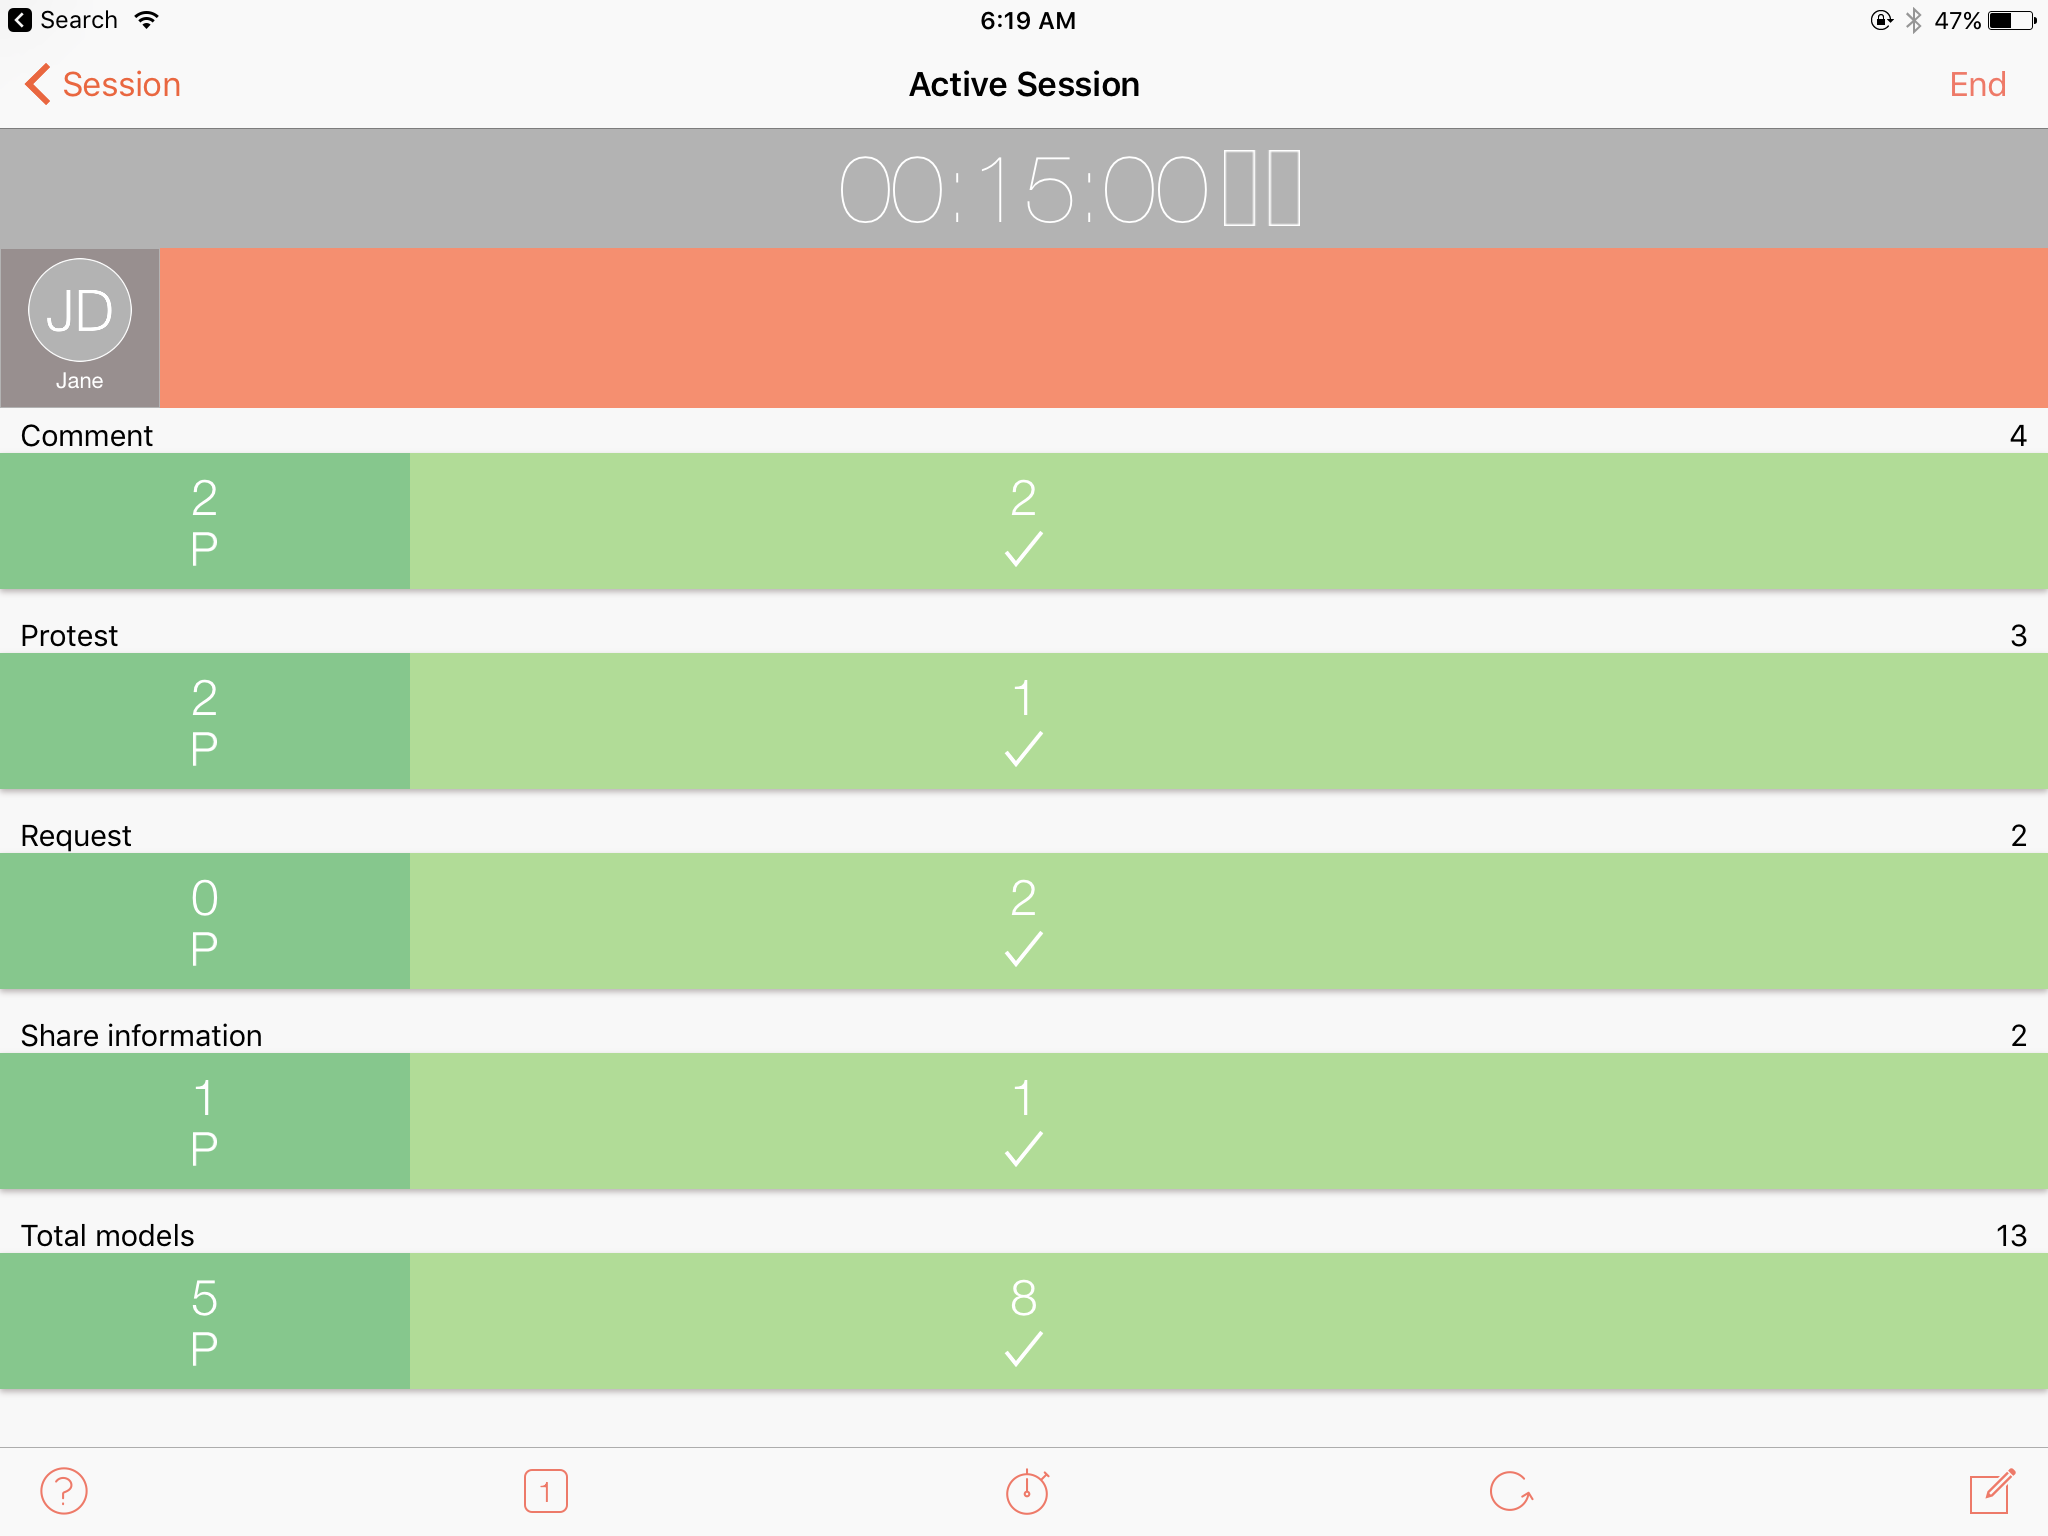
Below is a Percentally Pro 2 session for a sample communication partner, Jane Doe. The screenshot shows some of the goals tallied during a sample active session for Jane modeling after prompting from me (as indicated by the P in the small dark green rectangle), and modeling independently (as indicated with the checkmark in the big light green rectangle).
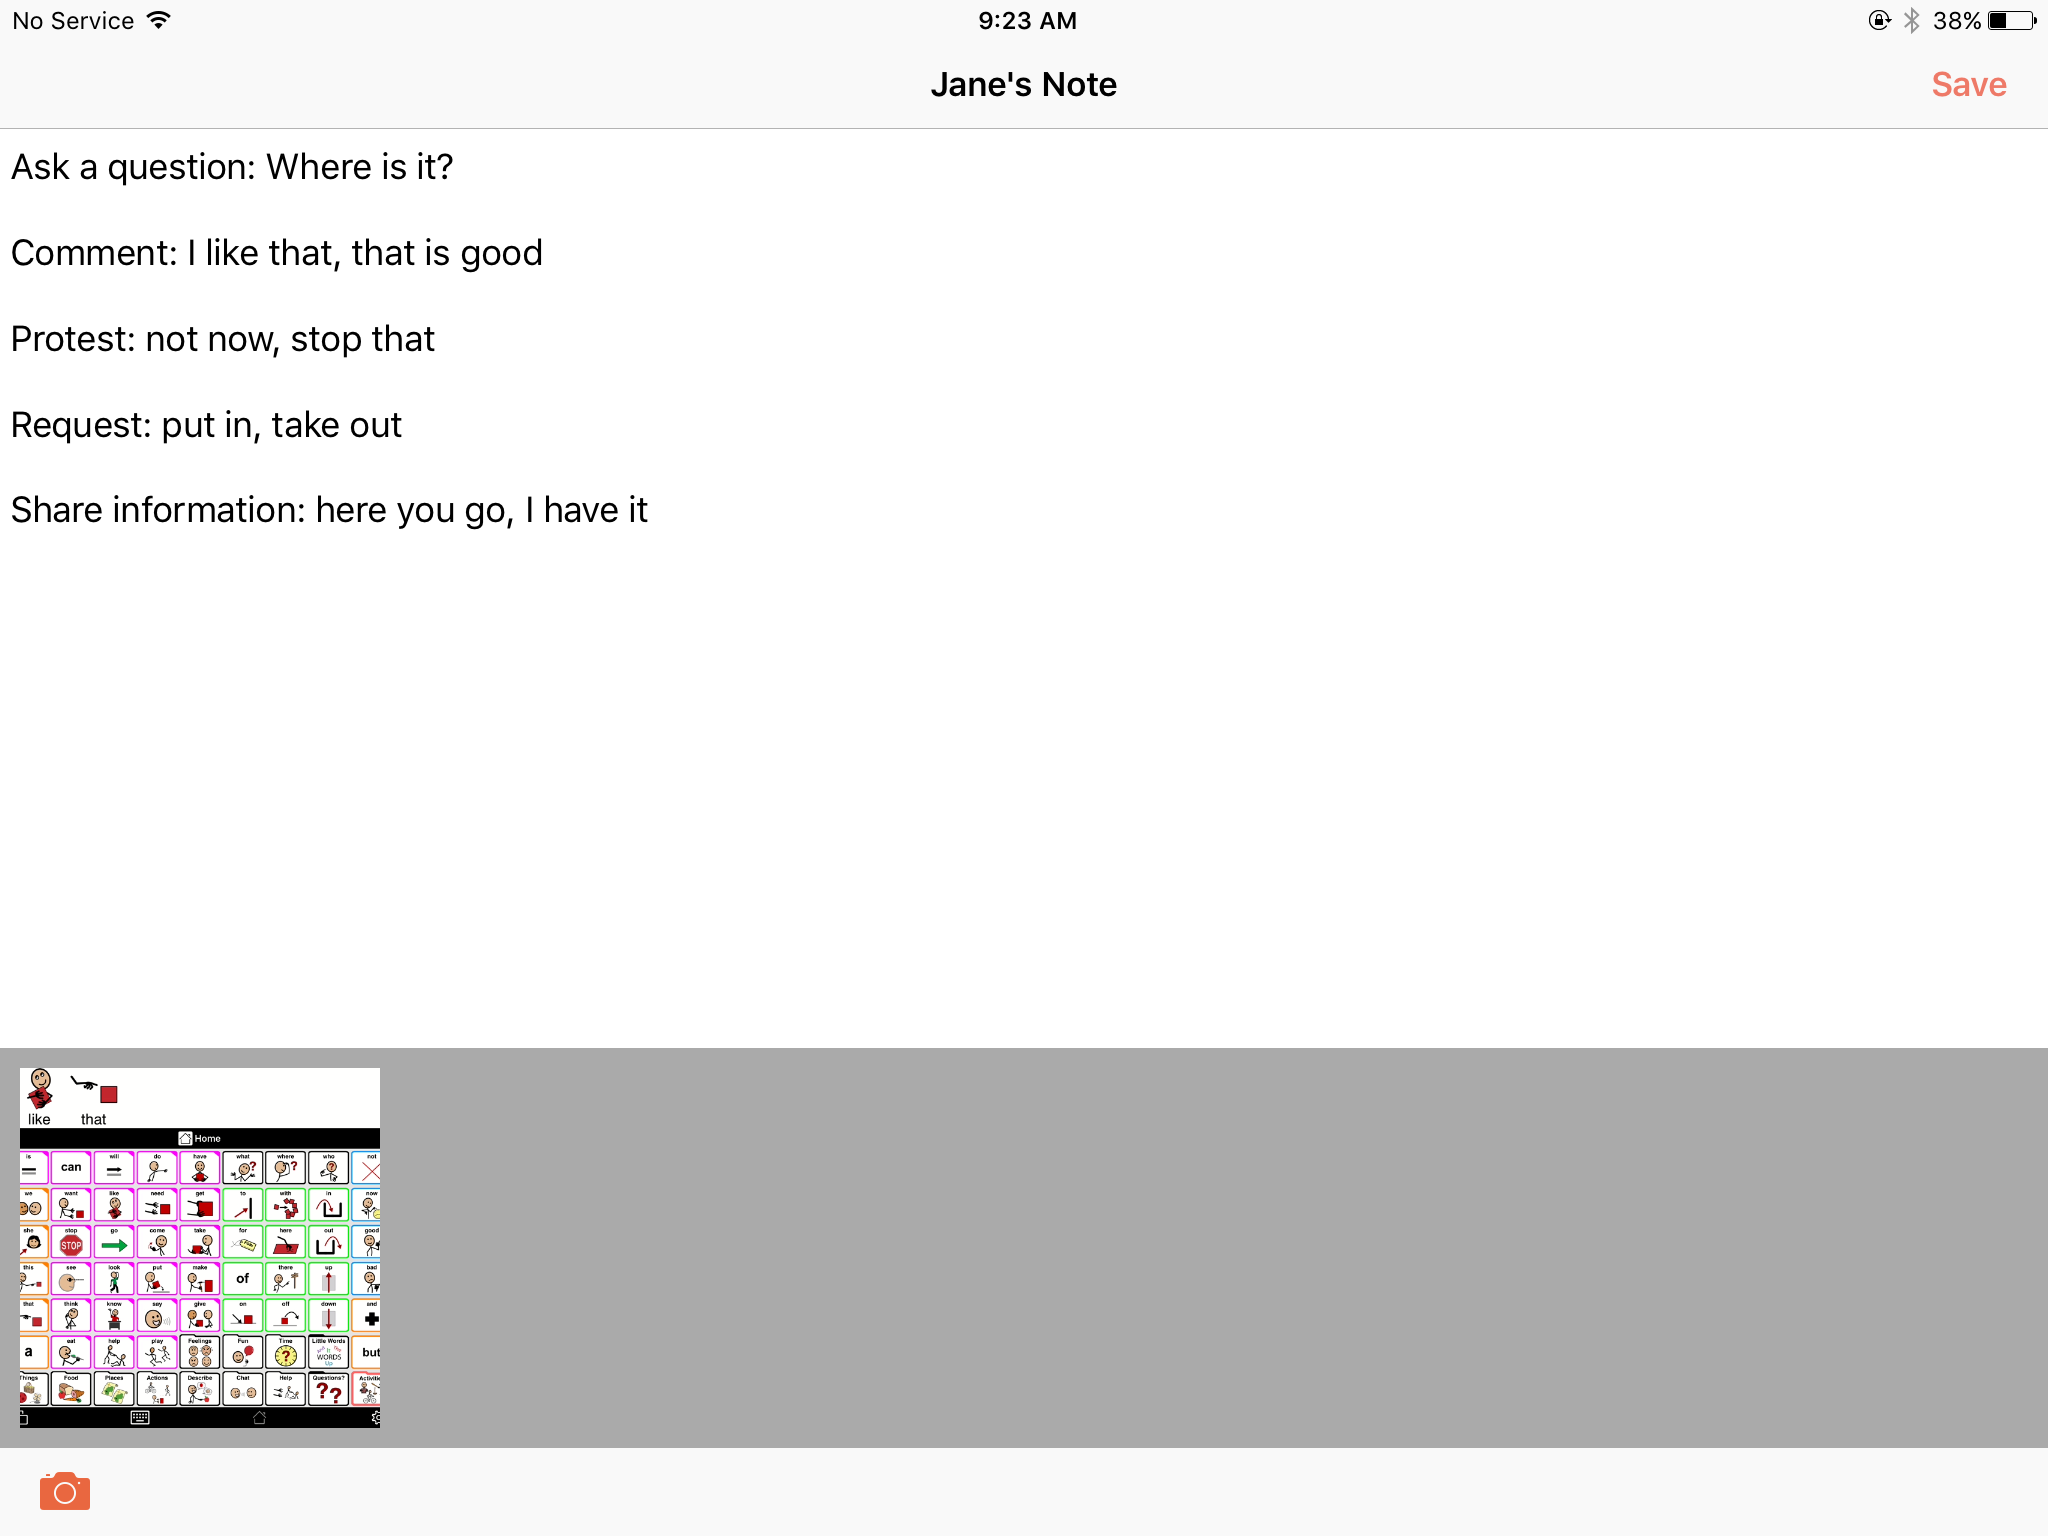
To correspond with the quantitative data, I take notes on the qualitative data in Percentally Pro 2. More specifically, I write notes for phrases modeled by the communication partner across the communicative functions. Occasionally, I will also include photos in the note for something modeled.
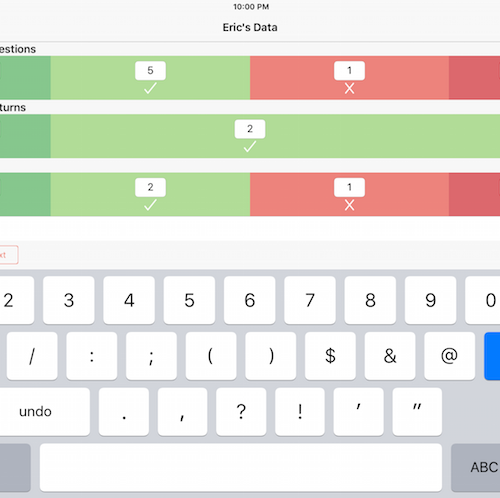
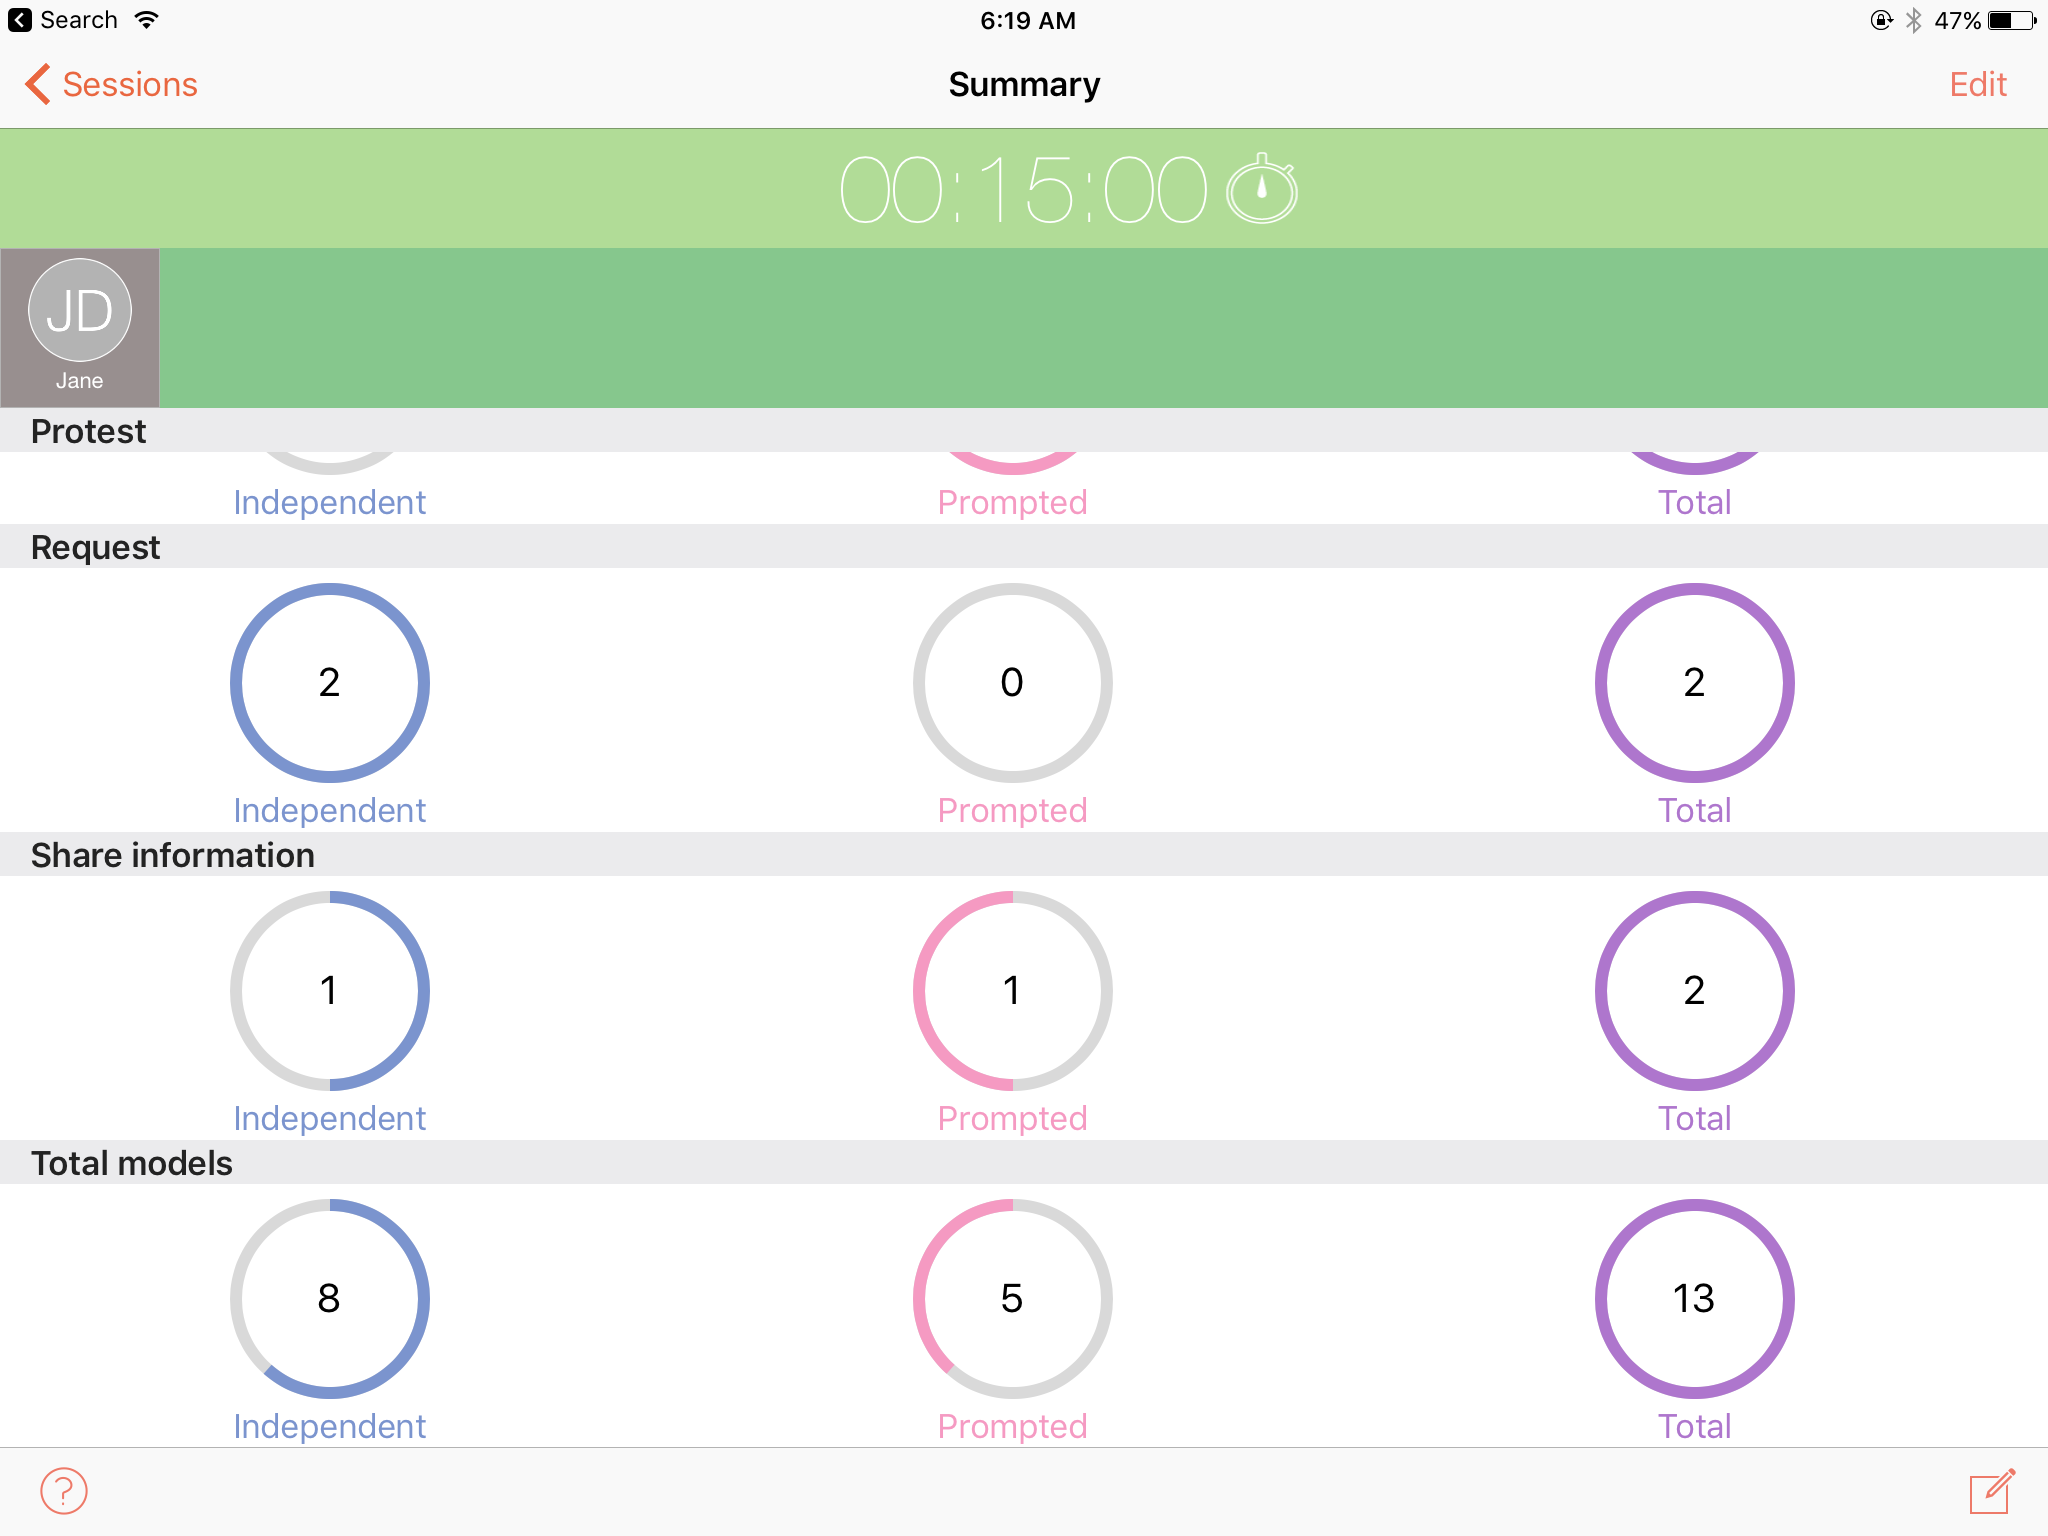
After the session, I view the session summary in Percentally Pro 2, so I can see a nice visual of the modeling frequencies via the ring views. In addition to seeing the totals, I like to compare the portion modeled independently vs. prompted for each goal. In the screenshot below, I see Jane’s sample data collected, including the following for ‘Total models’ – Independent : 8, Prompted : 5, Total : 13.
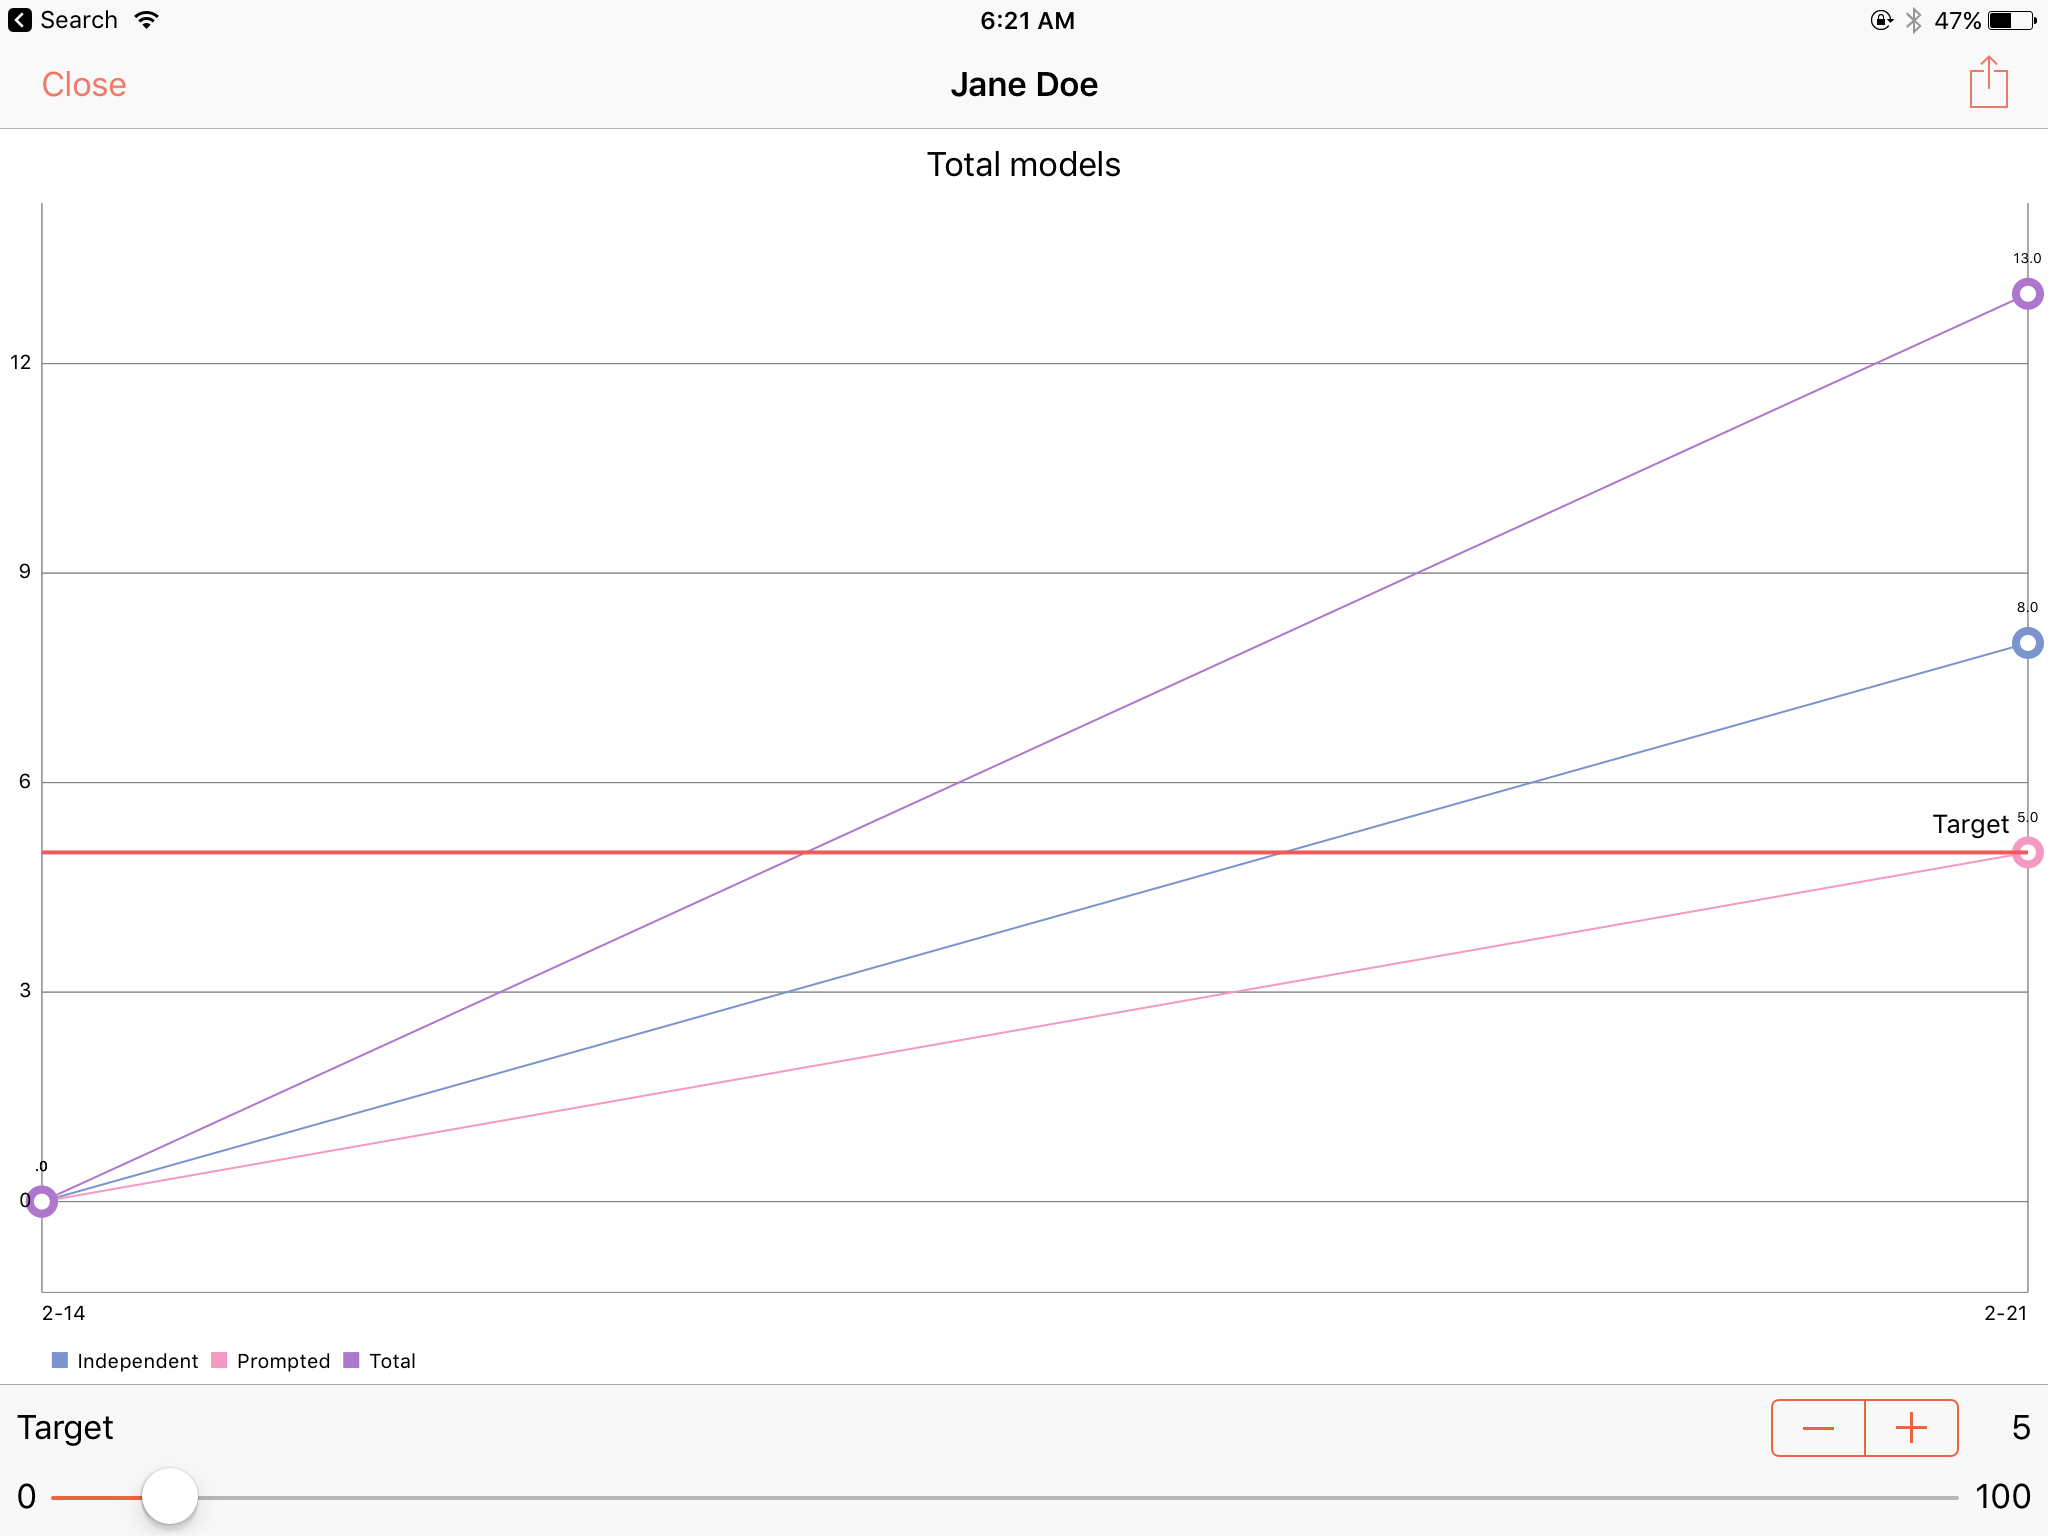
After 2-3 coaching sessions, I view and report the line chart for each goal. I am particularly interested in the line chart for ‘Total models’, which allows me to compare the communication partner’s frequency of total modeling to a target. When considering a recommended frequency of modeling 20x/hour, I compare the communication partner’s total models (independent in blue, prompted in pink, total in purple) to a target (I set) of 5 for a 15 minute period (calculated by 20 / 4 = 5). With the line chart, I can easily assess the communication partner’s modeling success over time, and show him/her as well as any other interested parties. Put another way, the line chart clearly shows whether the communication partner has made progress in his/her frequency of modeling, and whether he/she is modeling frequently enough.
Below, I see that Jane demonstrated 0 Total models (which is not uncommon, unfortunately) during a baseline measurement on 2-14; then, she demonstrated the following on 2-21 for Total models – Independent : 8, Prompted : 5, Total : 13, which correspond with the ring views above. All of the data points on 2-21 are at or above the target line of 5, indicating that she made progress (as compared with her baseline), and she’s modeling a sufficient amount.
I hope you find this information helpful for using Percentally Pro 2 to collect data on a communication partner’s modeling. Although I’m obviously biased, I truly believe the app provides what is necessary for adequately assessing the communication partner’s progress over time.