2015 Computer Science Education Week
Computer Science Education Week – an initiative to encourage K-12 students to learn about computer science – is December 7-13, 2015. As a speech-language pathologist who learned how to code iOS apps, I fully support the initiative. I think there are very fun and rewarding opportunities in the world of computer programming. And even if students have no desire to become computer programmers, they can still learn lifelong skills including creativity, logic, and problem solving through coding.
For the past two years, my students (middle school and high school ages) and I participated in the hour of code as part of CSED Week. We did the Angry Birds puzzles (ages 4+) that involve dragging-and-dropping “blocks of code” via a visual programming language in order for the red bird to capture the pigs.
This year, I’m planning to do the hour of code with a few of my 4th grade students and the rest of their regular education class. I’m interested in trying one of the new available activities, Minecraft or Star Wars. Similar to the Angry Birds puzzles, both activities have a visual programming language appropriate for their age. My students and their classmates would probably enjoy either, so we may have to vote at the beginning of the lesson. I’m looking forward to sharing the building blocks of programming with the students at my school.
Aside from doing the hour of code with school-age children, I’m interested in sharing my passion for text-based programming (namely, Swift) with older students and adults. Swift is a language that Apple released to the public in 2014, and it is used to create apps for iOS, Mac, Apple Watch, and Apple TV platforms. My giveaway app, Raffleway, is written in Swift, and I have also created prototype apps using the language. Since I have been recently working on a prototype for a new feature in my data collection app called Percentally Pro 2, I thought I would share it in this blog post.
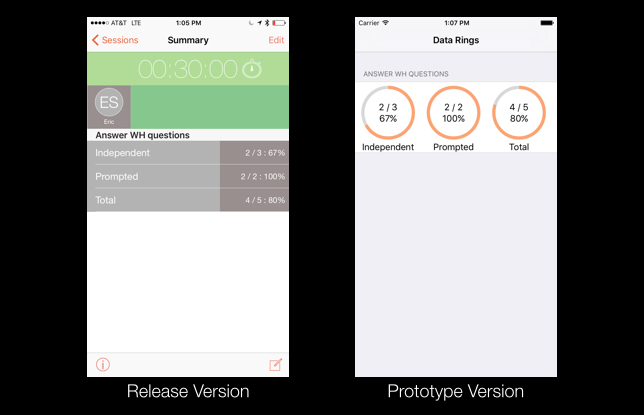
My prototype includes a visual representation of data for a student’s session that I’d like to add to the next update of Percentally Pro 2. To explain this better, I think it’s good to compare the release version of Percentally Pro 2 with the prototype. The release version of the app has a relatively simple table view of data while the prototype uses rings (like the ones in the Apple Activity app) in an alternate view for showing the data visually. Specifically, orange rings reflect percent correct with 100% displayed as a full ring, and anything less displayed as a fraction of the ring for Independent, Prompted, and Total data in a session. Below, you can see an image of the release version (on the left) and the prototype (on the right) showing what I mean with the data rings:
I recorded the following video to demonstrate how I created the data rings in an iOS prototype app. Please note that I used Xcode 7.1 with Swift 2 in the video.
I hope you enjoyed seeing how to create the data rings. I had fun sharing the process, and I can’t wait to include the feature in the next version of Percentally Pro 2.